Dark Matter Programme note: PFS/JDL Feb 1990/no 8
Effect of radioactivity in target, shielding and veto materials
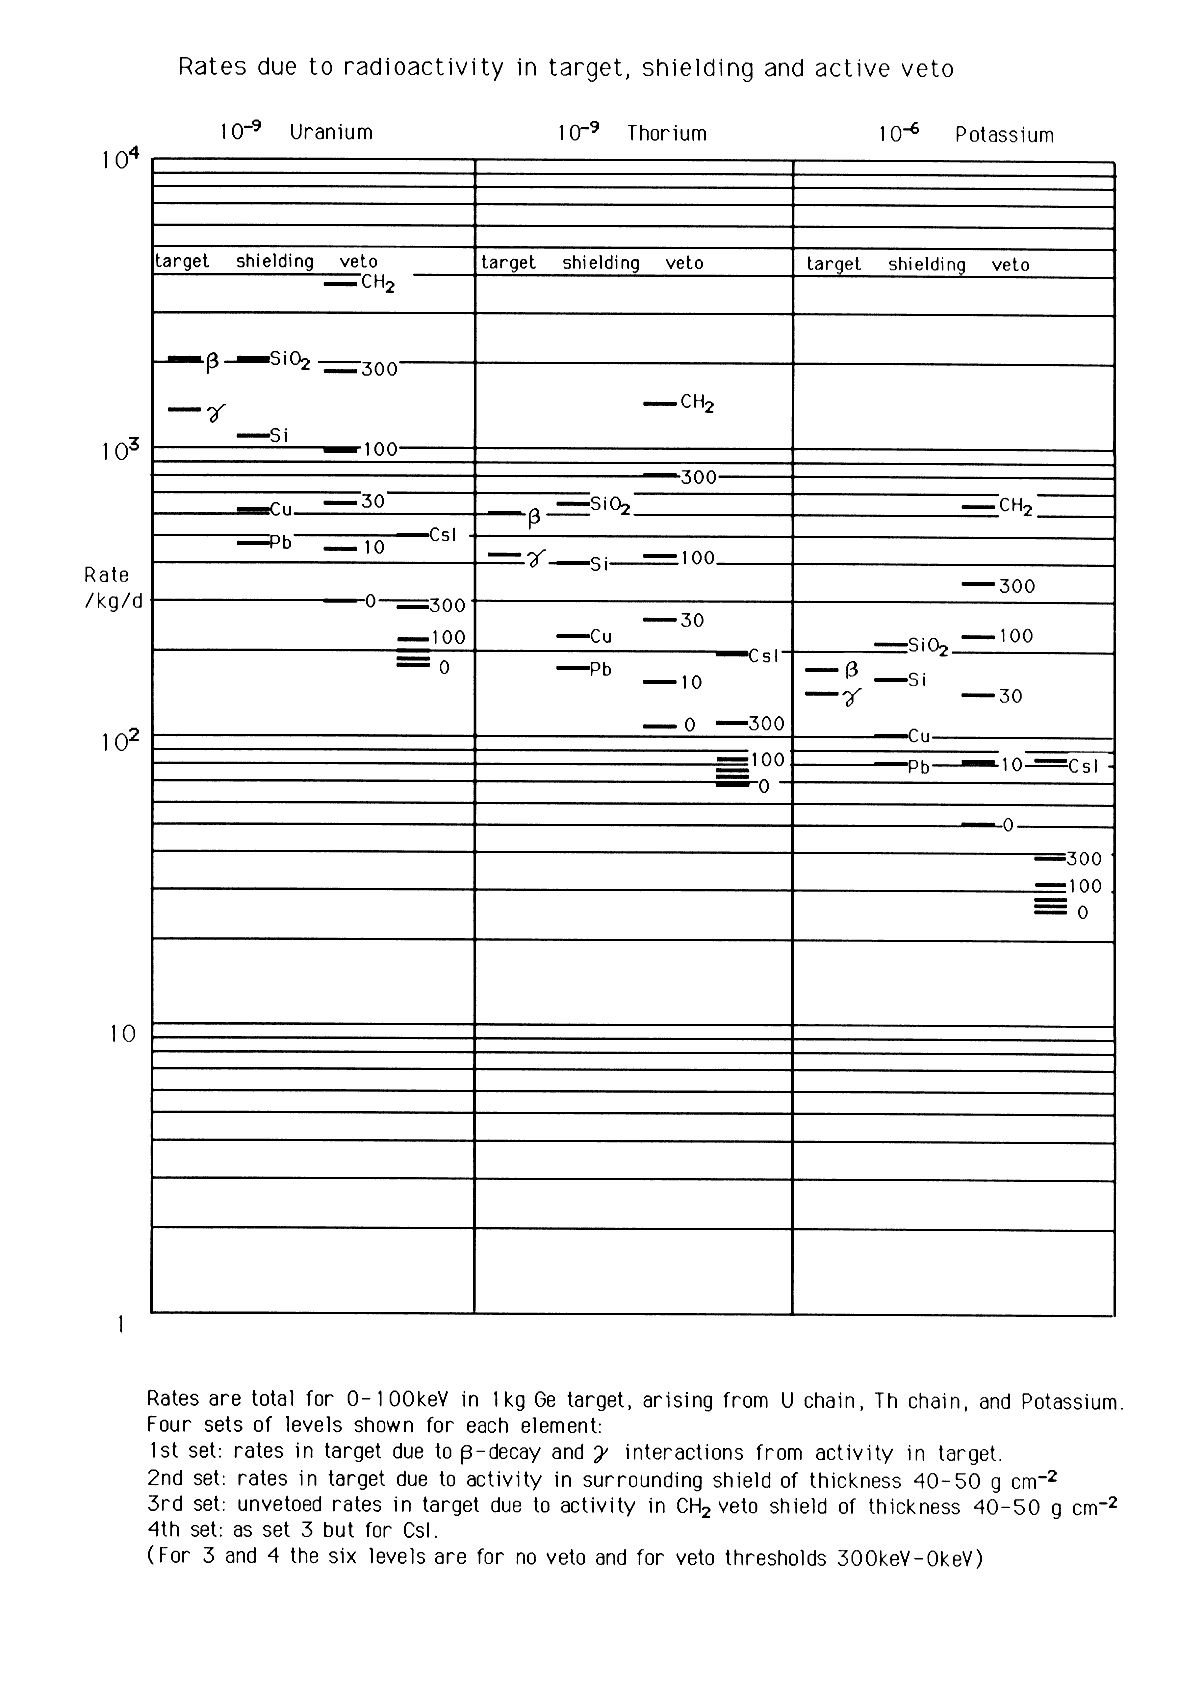
- The accompanying chart shows the main results from ~ 100 Monte Carlo simulations of
radioactive contamination by U, Th, and K. The vertical axis shows the rate per kg per day
for events < 100 keV in a 1 kg Ge detector arising from l ppb of U and Th (plus their
complete decay chain, assumed in equilibrium), or from l ppm of K.
- For each element, the left hand column shows the rate from beta decay and photon
interactions arising from activity in the target itself. The second set of levels shows
the effect of radioactivity in a surrounding shield of thickness about 2 attenuation
lengths and various materials. The two right hand sets are for activity in light and heavy
active veto materials CH2 and CsI, where there is some self vetoing depending
on the energy threshold. The effect of various thresholds 0, 10, 30, 100 and 300 keV is
shown.
- The potassium simulation includes low energy bremsstrahlung from the beta decay (which
contributes about a factor 2 below l00 keV). The U and Th chains include low energy X-rays
but not bremsstrahlung.
- The sets of levels are similar in form for the three elements, and in general l ppb U, 3
ppb Th, and 6 ppm K are roughly equivalent, and give counting rates in the 100-1000/kg/day
range. Thus concentrations of order 0.0l ppb U, 0.03 ppb Th, and 0.06 ppm K, would be
needed to attain counting rates of 1-10/kg/day. These requirements may be somewhat eased
in practice by several factors:
- There will be a significant degree of self-vetoing of the U and Th chains in a
subdivided target, due to two members of the chain decaying within a few hours in the same
target module. This could gain a factor 3-10 in the target activity (see detailed
calculation by J D Lewin in separate note).
- Photons from activity in the target are generally in coincidence with the alphas or
betas, so do not count in addition to the latter.
- An active veto may not require a thickness as much as 2 attenuation lengths, so that the
veto levels on the chart are upper limits. For example, for a thickness ~ 20 g cm-2
(~ 1 attenuation length) the rates will be about a factor 3 lower.
- The chart can be used to predict the expected underground rates from the measured
activities in the shielding and rock materials:
| |
ppb U |
rate |
ppb Th |
rate |
ppm K |
rate |
total |
measured |
| Cavern rock |
60 |
1.5/s |
100 |
0.8/s |
600 |
1.4/s |
3.7/s |
4.0/s |
| Lead castle |
2 |
970/d |
10 |
1750/d |
0.02 |
2/d |
2722/d |
3550/d |
| Cu castle* |
< 1 |
< 690/d |
2 |
392/d |
0.04 |
4/d |
< 1086/d* |
1222/d |
*with only 5cm Cu this rate should be increased by 24% due to the outer Pb.
The agreement is within the ~ 20% accuracy of both the activity measurements and the
Monte Carlo simulations.