Further PBS job statistics available here. Further disk usage statistics are available here. Statistics generated from Ganglia are available here.
(For details, see the RAL Tier1 PBS Efficiencies document on the GridPP Wiki.)
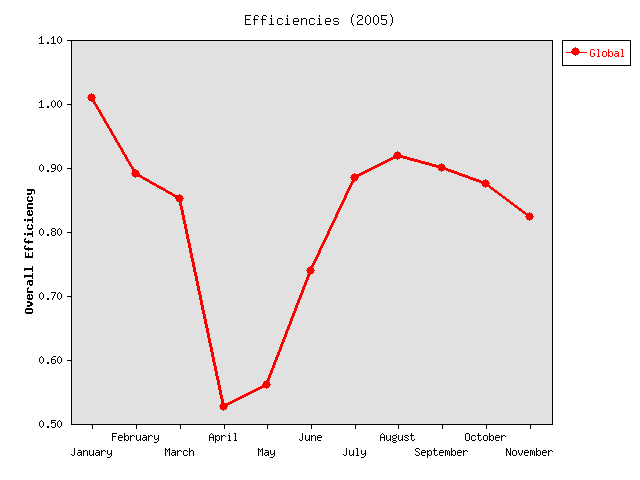
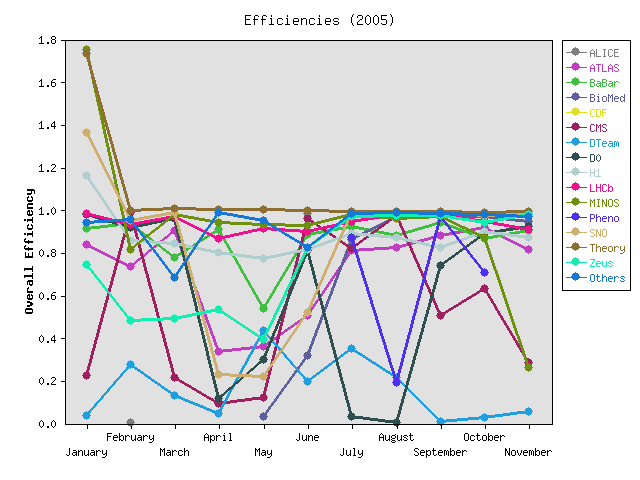
| Experiment | January | February | March | April | May | June | July | August | September | October | November |
|---|---|---|---|---|---|---|---|---|---|---|---|
| Global | 1.01 | 0.89 | 0.85 | 0.53 | 0.56 | 0.74 | 0.88 | 0.92 | 0.90 | 0.87 | 0.82 |
| ALICE | 0.00 | 0.98 | |||||||||
| ATLAS | 0.84 | 0.73 | 0.90 | 0.34 | 0.36 | 0.50 | 0.81 | 0.82 | 0.88 | 0.92 | 0.81 |
| BaBar | 0.91 | 0.94 | 0.77 | 0.90 | 0.54 | 0.88 | 0.92 | 0.88 | 0.94 | 0.87 | 0.90 |
| BioMed | 0.03 | 0.32 | 0.86 | 0.97 | 0.97 | 0.97 | 0.95 | ||||
| CDF | |||||||||||
| CMS | 0.22 | 0.99 | 0.21 | 0.09 | 0.12 | 0.96 | 0.82 | 0.97 | 0.51 | 0.63 | 0.28 |
| DTeam | 0.03 | 0.27 | 0.13 | 0.04 | 0.43 | 0.20 | 0.35 | 0.21 | 0.00 | 0.03 | 0.06 |
| D0 | 0.98 | 0.92 | 0.96 | 0.11 | 0.30 | 0.81 | 0.03 | 0.00 | 0.74 | 0.89 | 0.92 |
| H1 | 1.16 | 0.86 | 0.84 | 0.80 | 0.77 | 0.82 | 0.89 | 0.87 | 0.82 | 0.90 | 0.87 |
| LHCb | 0.98 | 0.93 | 0.97 | 0.87 | 0.91 | 0.90 | 0.94 | 0.98 | 0.98 | 0.95 | 0.91 |
| MINOS | 1.75 | 0.82 | 0.98 | 0.94 | 0.93 | 0.93 | 0.98 | 0.96 | 0.97 | 0.87 | 0.26 |
| Pheno | 0.87 | 0.19 | 0.97 | 0.70 | |||||||
| SNO | 1.36 | 0.95 | 0.99 | 0.23 | 0.22 | 0.52 | 0.98 | 0.98 | 0.98 | 0.97 | 0.98 |
| Theory | 1.73 | 1.00 | 1.00 | 1.00 | 1.00 | 1.00 | 0.99 | 0.99 | 0.99 | 0.99 | 0.99 |
| Zeus | 0.74 | 0.48 | 0.49 | 0.53 | 0.39 | 0.82 | 0.97 | 0.97 | 0.97 | 0.94 | 0.98 |
| Others | 0.94 | 0.95 | 0.68 | 0.99 | 0.95 | 0.82 | 0.98 | 0.99 | 0.98 | 0.98 | 0.97 |
Key: 0 <= eff < 0.75; 0.75 <= eff < 0.9; 0.9 <= eff < 1; eff >= 1.
All previous efficiency statistics.